|
|
Post by cuttydyer on Jan 28, 2013 22:44:31 GMT
I'm pretty sure the Met Office are not predicting flat temperatures for anywhere near 20 years into the future. Ultimately the Met Office decadal forecasts are all about is identifying what natural causes are preventing temperatures from rising due to rising CO2. I hope that the MET won't forget to also investigate the natural causes that increase global temperatures (exaggerating the apparent effects of CO2). |
|
|
|
Post by cuttydyer on Jan 28, 2013 22:30:04 GMT
The South West has had yet another soaking. The stream running through the property has once again burst its banks and in the process almost washed the hen house away. Still here’s someone who sensibly puts this weather pattern into perspective (way back in 2008). See: www.dur.ac.uk/news/newsitem/?itemno=6468Prof. Lane shows that the British summer can often be very wet – about ten per cent of summers are wetter than a normal winter. What we don’t know is whether climate change will make this happen more in the future. However, in looking at longer rainfall and river flow records, Prof. Lane shows that we have forgotten just how normal flooding in the UK is. He looked at seasonal rainfall and river flow patterns dating back to 1753 which suggest fluctuations between very wet and very dry periods, each lasting for a few years at a time, but also very long periods of a few decades that can be particularly wet or particularly dry. In terms of river flooding, the period since the early 1960s and until the late 1990s appears to be relatively flood free, especially when compared with some periods in the late 19th century and early 20th Century. |
|
|
|
Post by cuttydyer on Jan 27, 2013 7:18:13 GMT
I have the north/south sunspot number graph in Excel from the start of 1992 through the end of 2012. How do I post it to this board? Chicken LIttle Go to help :http://www.proboards.com/forum-help-guide/create-forum-thread then see the "attachment" entry: Attachment: If you're creating a thread on a message board that allows attachments, Attachment will be the second option listed on the posting page. This can be used to attach files from your computer and have them display in your thread when the topic is posted. For example, if you want to attach a picture of your pet, use the attachment feature to upload the image and a thumbnail image of your pet will be displayed at the bottom of your forum post. Members can then click on the thumbnail to see an enlarged image. You can submit one attachment per post with a maximum file size of 1MB. The graph could also be converted to an image file, saved in photobucket (or similar) then the direct link can be copied into the "insert image" tool (see add tags). |
|
|
|
SSW
Jan 24, 2013 9:34:48 GMT
Post by cuttydyer on Jan 24, 2013 9:34:48 GMT
[/quote]Space weather is about impact on satellites, electrics and so forth (radiation, atmosphere impacts on orbits...?). I don't think it has much (yet) to do with forecasts for the ground.[/quote]
You suspect the MET Office will not be investigating the effects of space weather on terrestrial weather? - that would be a shame. I suppose its best left to those who know what they're doing (Henrik Svensmark etc..)
|
|
|
|
SSW
Jan 23, 2013 8:26:05 GMT
Post by cuttydyer on Jan 23, 2013 8:26:05 GMT
|
|
|
|
Post by cuttydyer on Jan 22, 2013 11:09:29 GMT
|
|
|
|
Post by cuttydyer on Jan 22, 2013 8:45:34 GMT
cuttydyerWelcome! The tractor in your avatar looks to be an (old) Ferguson. Great, safe tractor. ;D Thanks Pooh, Been lurking for a couple of years – it’s a great forum; thoroughly enjoyed following the debates (whilst gaining a modicum of insight into climate & weather). The tractor is a Fordson Major (very similar to a Ferguson TE20); the paints almost obscured by rust but the orange wheels and blue body are just visible. |
|
|
|
Post by cuttydyer on Jan 21, 2013 15:08:25 GMT
It seems quite possible that what you have observed are changes due to the AMO changing. Nautonnier, Thanks for the link; AMO on-line research looks interesting. |
|
|
|
Post by cuttydyer on Jan 21, 2013 9:44:31 GMT
Doesn’t the majority of the current usually flow to the east of Iceland? The sea temperature charts having been showing the high temp anomaly between Greenland and Iceland for a while now. The NOAA current chart appears to show the majority of the horizontal surface current flowing in the same location (indicated with white arrow). Temp: 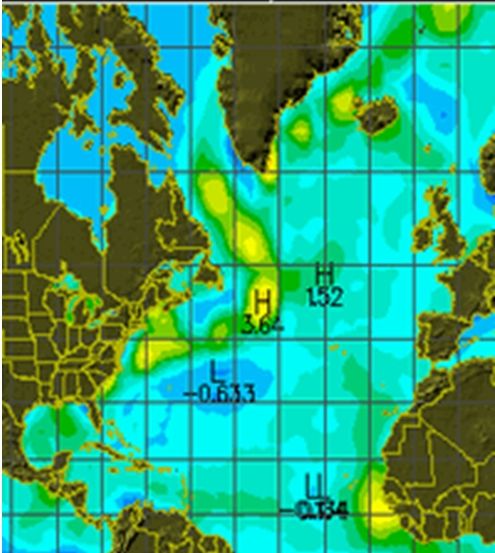 Current: 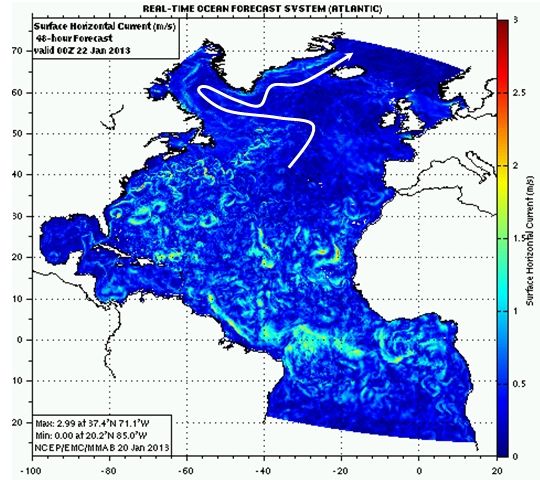 Can any Gulf Stream watchers shed any light on this for me? All the current charts I can find indicate the majority of current flowing to the east of Iceland with only a small tributary of current flowing to the west, which then loops around the top to join the main current flowing to the east. |
|
|
|
Post by cuttydyer on Jan 18, 2013 13:38:40 GMT
If you really want to put things into perspective, you should be aware of the fact that the historic (the 1700s, 1800s till 1876) observations for England are a stitchup of various records of differing quality.  Thanks for the link; interestingly, the conclusion doesn’t hold concerns about the validity of historic data only the impact on “urban warming” on current measurements. |
|
|
|
Post by cuttydyer on Jan 18, 2013 5:50:29 GMT
The data plotted (2012 back to the late 18th C); puts 2012 into perspective:  |
|
|
|
Post by cuttydyer on Jan 16, 2013 13:13:22 GMT
A statement that the year is the wettest since 1910 is just that - a statement. The wettest year in a hundred is an interesting fact. As you go further back, the data is more sketchy so the uncertainties rise. What looks like a very wet year in the 1700s may have been down to a few heavy showers that happened to hit a few places where rain was being measured. But I don't believe anyone has drawn any conclusions about this factoid. But the Met didn't have to go back to the 18th Century to find a wetter period, they could have mentioned in 1873 (that's just 37 years before 1910) the UK & Northern Hemisphere flooding was far more severe than what we have just experienced. If the Met Office are going to brand weather events as climatic events they should really widen their time frame beyond 100 years. Ohio USA 1873:  Gympie ca 1873:  Prague 1873:  Oxford 1873:  |
|
|
|
Post by cuttydyer on Jan 16, 2013 12:38:36 GMT
|
|
|
|
Post by cuttydyer on Jan 15, 2013 12:29:51 GMT
|
|
|
|
Post by cuttydyer on Jan 10, 2013 15:47:37 GMT
|
|